Purpose Built Student Accommodation SPD
Residential Analysts
Student Housing Need in Warwick District
Summary Report & Evidence Review
Report for Warwick District Council 16 May 2018
Summary Report
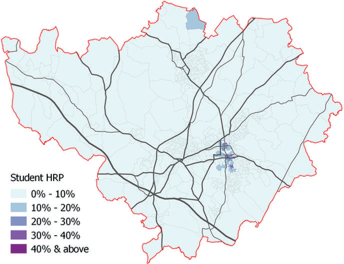
Warwick district is home to many students, with nearly 3% of households headed by a full-time student in 2011 compared to 1.8% across England & Wales. That may not be a significant proportion of total households across the district but, as Figure 1 shows, there are high concentrations in specific local wards (2011 based). These include nearly 10% of households in both Brunswick and Clarendon, 6.6% in Willes, and 5.2% in Milverton.
Figure 1 – Student Households & Other Private Renters by 2011 Ward
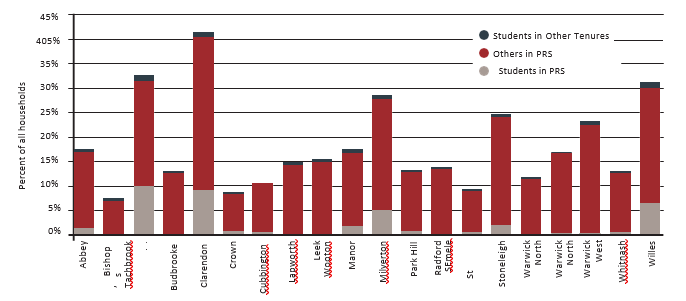
Source: 2011 Census (excludes students in halls of residence)
Students' contribution to the local community and economy is important but there are other implications for these areas of high student concentration. This is particularly the case in areas such as the centre and south of Royal Leamington Spa. However, as Figure 1 also shows, even in locations with high proportions of student households most private renters are non-students. Care needs to be taken to balance not just the needs of students versus the needs of home-owners but also versus those of other private renters, including the many single person and family households in the sector.
The impact of high concentrations of HMOs, often lived in by students but not exclusively, can sometimes include but is not limited to: a more transient population, noise complaints, issues with rubbish, and other anti-social behaviour. An Article 4 Direction and other initiatives have been used to help manage these issues.
To assess the potential impact of any growth in student numbers at the University of Warwick, we have looked at where existing students live and available forecasts for future numbers. The forecasts provided by the University of Warwick indicate they are seeking to grow their student numbers in future years, albeit at a relatively slow rate. This will increase demand for student housing in the district, putting further pressure on existing housing and communities.
However, it is not enough to just look at total student numbers at the University of Warwick. Warwick district is not a self-contained student housing market as it is closely linked with Coventry district. As Figure 2 shows, students at the University of Warwick live in both districts. The postcode district CV4, where the university is located, is split across the two districts. CV31 and CV32 are in Warwick district while CV1 and CV5 are in Coventry district. With a choice of where to live across the two districts, any changes to student numbers at Coventry University and student housing supply in Coventry district will have an impact on student housing demand in Warwick district.
Figure 2 – Postcode District of Residence, University of Warwick, 2017/18
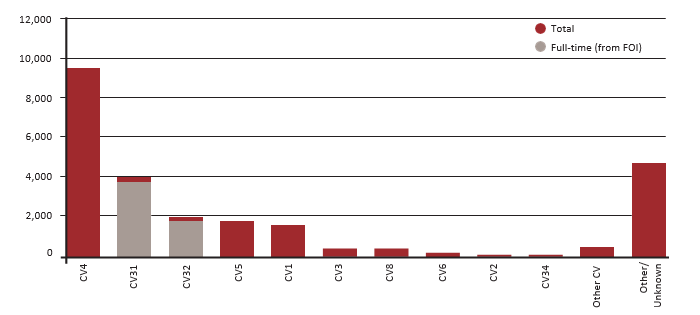
Source: University of Warwick
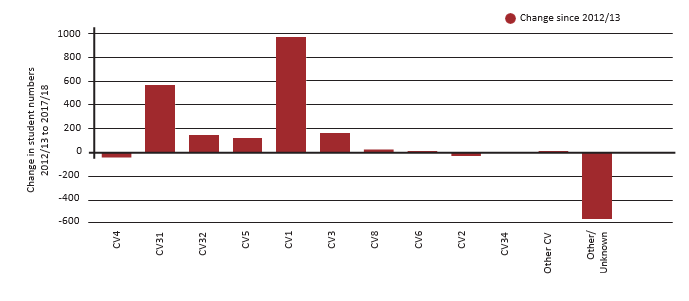
The links between two districts can be seen in Figure 3 which shows the change in where University of Warwick students live over the last five years. The biggest numerical increase is seen in central Coventry, CV1, which has benefitted from substantial development of purpose-built student housing in recent years. However, despite this growth, there has still been an increase in students living in Warwick district, specifically Royal Leamington Spa.
Figure 3 – Change in Postcode District of Residence, 2012/13 to 2017/18
Forecasts published by Coventry University suggest they are looking to continue their recent robust growth in student numbers. However, the increase in student numbers is being met by the substantial development of purpose-built student housing. Therefore, despite the increase in student numbers, the number of beds available in the purpose-built sector will increase and so demand for beds in the private rented sector is falling and will likely continue to fall. Anecdotal evidence from the Coventry market suggests that landlords are finding it difficult to find enough student tenants. It is quite likely that this surplus private rented housing will be occupied by other non-student private renters or sold to home-owners.
Despite the increased competition from Coventry, Warwick district remains an attractive place to live for many students and the council should seek to benefit from any increase in student numbers. Using available forecasts for student numbers and estimates of student housing supply, a residual number of students that would need to be housed in the private sector can be calculated (as seen in Figure 4). Based on these calculations, there will be an estimated increase of 900 University of Warwick students needing to be housed in the private sector over the next three years. The latest trends in where University of Warwick students live suggest that around 360 of these students will live in Royal Leamington Spa.
Figure 4 – University of Warwick Student Housing Supply & Demand
| |
2015/16 |
2016/17 |
2017/18 |
2020/21 |
Change2017-18to 2020/21 |
|
Full-time Students |
19,200 |
20,000 |
21,500 |
22,800 |
1,300 |
|
University Beds |
6,400 |
6,500 |
6,800 |
7,200 |
400 |
|
Nomination Agreements |
600 |
500 |
1,100 |
1,100 |
- |
|
Residual |
12,200 |
13,000 |
13,600 |
14,500 |
900 |
Source: calculated using University of Warwick and other data
Meeting this increased student housing demand in the private rented sector via HMOs risks increasing the pressure on everyone in the community, including students. Additionally, it remains to be seen whether there is sufficient demand from landlords given national tax changes and other considerations limiting demand for new purchases. While the University of Warwick should be encouraged to increase housing provision on campus, the purpose-built sector is ideally placed to cater for the additional student housing demand. Relying on the purpose-built sector is not without risk but it can help accommodate more students and reduce the pressures if planned for appropriately.
Evidence Review
This section of the report contains further evidence used to create the summary report.
The best source for local information on demographics and housing is the Census. Unfortunately, the 2011 Census is increasingly out-dated. However, it still provides a useful reference for understanding local markets and can be cross-referenced against timelier national and regional data.
In 2011 Warwick district had a broadly similar tenure distribution to the national average, though with a slightly higher proportions living in privately owned tenures. National data suggest the private rented sector has grown by only around 2 percentage points since 2011 and so the Census data should still be broadly indicative of trends in the local market.
Figure 5 – Housing Tenure, 2011
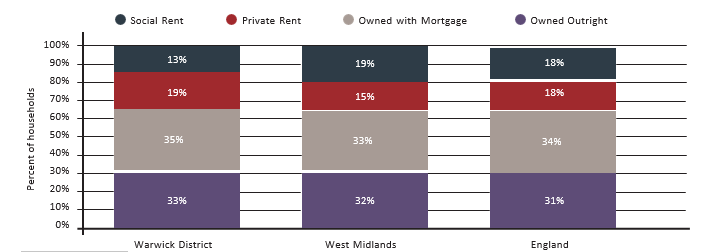
Source: 2011 Census
Much of the following analysis is undertaken using 2011 wards. These do not exactly match current (2016) wards and so the two maps in Figure 6 are provided. The left-hand map shows the boundaries and names of 2011 wards while the right-hand map shows the difference in boundaries between 2011 (red) and 2016 (blue).
Figure 6 – 2011 Ward Names and Comparison With 2016 Ward Boundaries
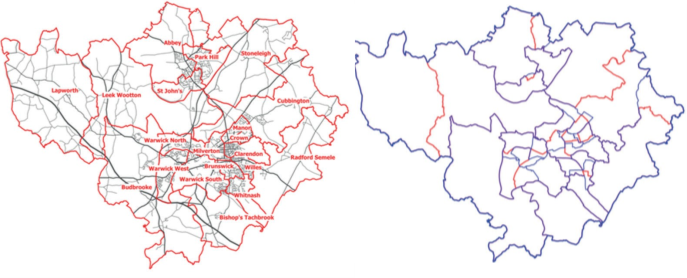
Source: ONS
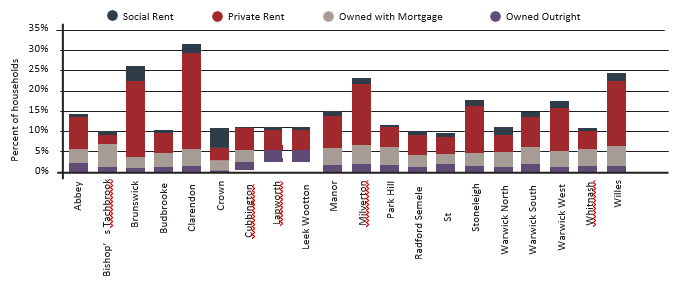
Investigating housing tenure by ward across Warwick district highlights significant variation. The wards with the highest rates of private renting were: Clarendon (40%), Brunswick (32%), Willes (30%), and Milverton (28%). In 2011 these four wards housed 44% of all private rented households living in Warwick district. These are also the four wards with the highest proportions of student households.
Figure 7 – Housing Tenure by 2011 Ward
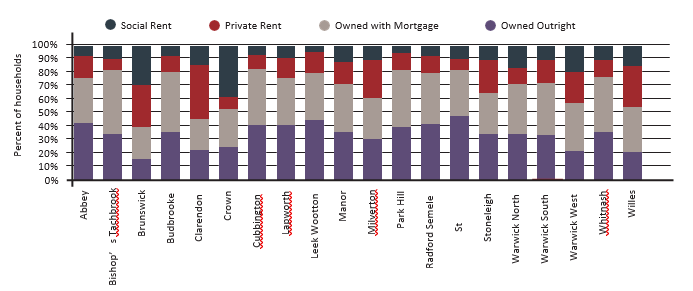
Source: 2011 Census
Figure 1 has already shown that most private rented households are not student households. Figure 8 reinforces this point by showing that most private rented households are single family and one-person households rather than multi-family households. This is true across all wards in Warwick, even those with the highest proportion of student households.
Figure 8 – Private Renter Household Composition by 2011 Ward
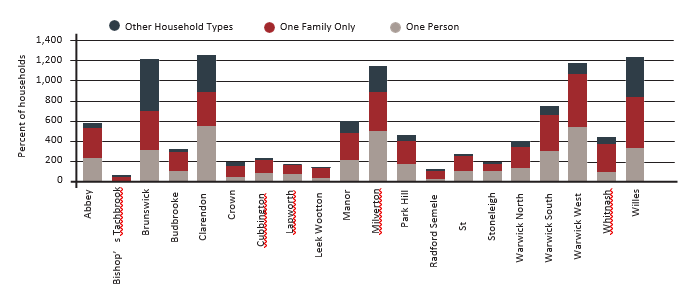
Source: 2011 Census
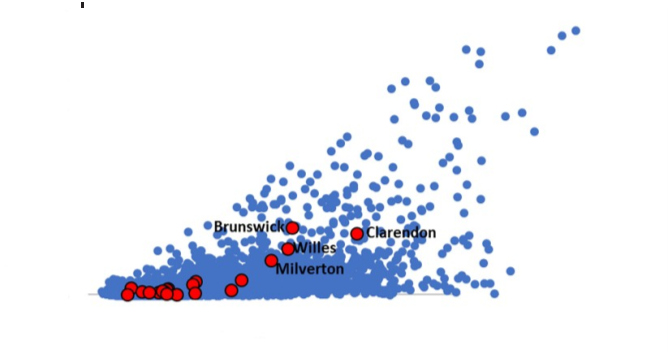
Figure 10 provides a comparison of all wards across England and Wales in terms of the proportion of households living in the private rented sector (x axis) and the proportion of households headed by a full-time student (y axis). All wards in Warwick are highlighted in red while the four wards with the highest rate of private renting and student households are also labelled. It shows that, while the rates are relatively high and above the typical national range, there are other local areas across the country with similar or higher proportions of private renting and student households.
Figure 10 – Comparison of Wards Across England & Wales, 2011
Students may not form the majority of households at a ward level but analysis at Output Area, the lowest publicly available Census geography, shows that there are very local areas in Royal Leamington Spa with very high concentrations of student households.
Figure 9 – Student Households as % of Total by 2011 Output Area
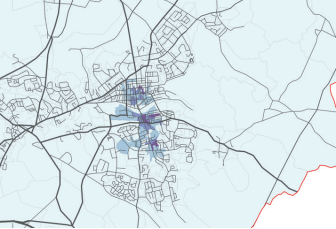
Source: 2011 Census
As noted in the summary report, high concentrations of private renters will typically lead to a more transient population in the local area. Figure 11 shows the percent of households that either partially or wholly moved in the year leading up to the 2011 Census along with the tenure of the household. The impact of the four wards with the highest proportions of private renters and student households can be seen. 31% of all households in Clarendon, 26% in Brunswick, 24% in Willes, and 23% in Milverton partially or wholly moved in the year.
Figure 11 – Households Partially or Wholly Moved by 2011 Ward
Source: 2011 Census
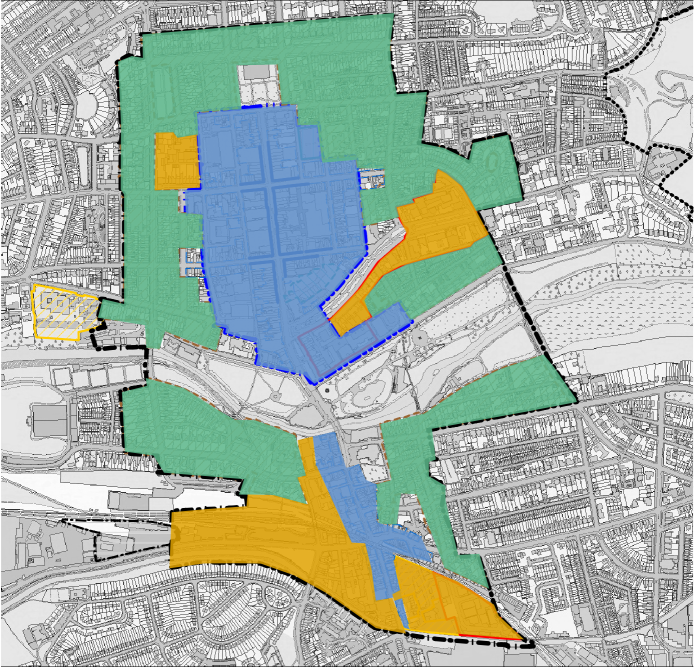
Areas with high concentrations of HMOs may also experience more issues with rubbish. The hotspot map below, created by Warwick District Council, highlights areas in south Leamington Spa with large numbers of waste issues. There is some correlation with this map and the map in Figure 9.
Figure 12 – Hotspot Map of Waste Issues in Royal Leamington Spa
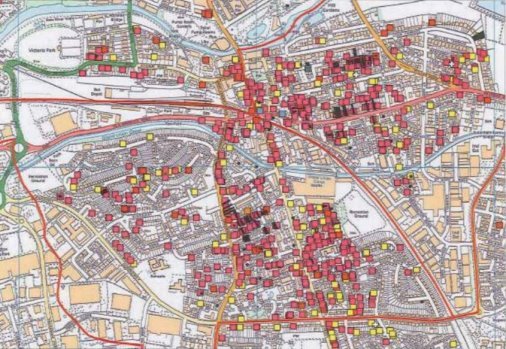
Source: Warwick District Council
Comprehensive data on the available supply of student housing is limited. However, the Council Tax base provides a useful reference, particularly the dwellings excluded due to:
- class M: A hall of residence provided predominantly for the accommodation of students
- class N: A dwelling which is occupied only by students, the foreign spouses of students, or school and college leavers.
Comparison of the number of excluded dwellings/halls of residence in Warwick and Coventry districts shows two different patterns. The number of exempted properties in Warwick has increased by 12% since 2011 while the number in Coventry has increased by 39% over the same period. All the increase in Coventry has occurred since 2014 and probably reflects the substantial increase in available student housing in the district.
Figure 14 – Council Tax base – Class M/N Exemptions
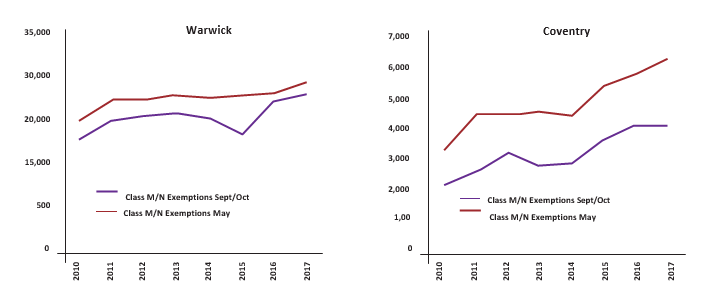
Source: MHCLG
To assess the future student housing need in Warwick district, forecasts of future student numbers are required. We have created forecasts for full-time and part-time student at both the University of Warwick and Coventry University. These are based on historic data from HESA, data provided by the University of Warwick, published documents from Coventry University, and trend-based analysis. They are the best available estimates but may be subject to change in the event of more detailed information being released.
Part-time student numbers at the University of Warwick have seen a large fall in recent years. This decline is expected to continue while full-time student numbers will continue to slowly increase over the forecast period.
Figure 15 – University of Warwick Projected Student Numbers
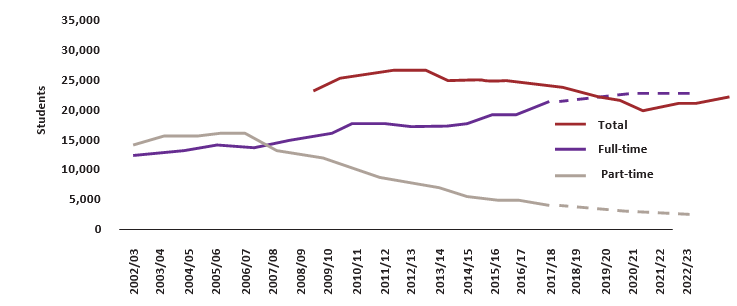
Source: HESA, University, Author's Estimates
Coventry University has also seen a decline in part-time student numbers but this has been more than compensated for by the rapid increase in full-time student numbers. This is expected to continue but there are significant risks to the forecast, including the expected growth in international student numbers failing to materialise.
Figure 16 – Coventry University Projected Student Numbers
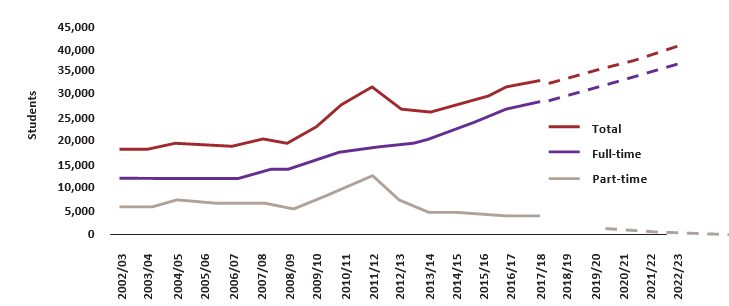
Source: HESA, University, Author's Estimates
Figures 17 and 18 provide a more detailed university-based breakdown of supply and demand that is summarised in Figure 4 of the Summary Report. Although the number of students at Warwick is expected to grow slower than at Coventry, the lack of identified supply increases results in a need for the private sector to absorb an additional of 900 students over the next three years. Meanwhile, the robust growth in Coventry student numbers will be met by the continued growth in both university and private provider purpose-built accommodation. That will see fewer students needing to find somewhere to live in Coventry's private rented sector.
Figure 17 – University of Warwick Estimated Housing Need
| |
2015/16 |
2016/17 |
2017/18 |
2018/19 |
2019/20 |
2020/21 |
Change 2017-18to 2020/21 |
|
Full-time Students |
19,200 |
20,000 |
21,500 |
22,100 |
22,500 |
22,800 |
1,300 |
|
University Beds |
6,400 |
6,500 |
6,800 |
6,600 |
6,900 |
7,200 |
400 |
|
Nomination Agreements |
600 |
500 |
1,100 |
1,100 |
1,100 |
1,100 |
- |
|
Private Sector |
12,200 |
13,000 |
13,600 |
14,400 |
14,500 |
14,500 |
900 |
Source: HESA, University, Author's Estimates
Figure 18 – Coventry University Estimated Housing Need
| |
2015/16 |
2016/17 |
2017/18 |
2018/19 |
2019/20 |
2020/21 |
Change 2017-18to 2020/21 |
|
Full-time Students |
24,700 |
27,200 |
28,500 |
29,900 |
31,400 |
33,000 |
4,500 |
|
University Beds |
|
|
1,800 |
3,300 |
3,800 |
3,800 |
2,000 |
|
Nomination Agreements |
|
|
5,900 |
7,600 |
10,500 |
12,600 |
6,700 |
|
Private Sector |
|
|
20,800 |
19,000 |
17,100 |
16,600 |
-4,200 |
Source: HESA, University, Council, Author's Estimates
Appendix 2
Benchmarking Parking Standards
Of those LA's that were found to include bespoke standards, there is significant variation in the amount of parking spaces required, and it is unclear what evidential basis has been used in determining these. Several authorities have adopted a zonal approach to parking standards which clearly differentiates between central more accessible areas and those further toward the periphery.
The following table demonstrates that relatively few local authorities specify parking standards for this land use. Furthermore, disparate results have emerged from the benchmarking. The draft SPD is proposing a single standard for PBSA's (i.e. it is not proposing to define zones and PBSAs on campus for example, might benefit from a different standard to those located in other areas of the district.
There is a wider debate regarding the desirability of students bringing cars to their place of study and management arrangements for controlling and enforcing parking in PBSAs. In addition, there is concern that over-specifying parking standards could encourage greater numbers of students to bring cars, or result in large areas of underutilised land.
Benchmarking Table
|
Cardiff 2010 Parking Standards |
Newport 2015 ParkingStandards |
Birmingham 2012/Newport 2015 ParkingStandards |
Nottingham2016Emerging ParkingGuidance |
|
Sui Generis PBSA in All areas: 1 space per 25 beds, and 0.25 cycle visitor short spaces in addition at 0.05 per unit |
PBSA within the City Centre: 1 space per 25 beds for servicing, wardens anddrop-off areas, with no visitor spaces. PBSA (under college/ university control) outside of the City Centre: 1 space per 25 beds for servicing, wardens and drop-off areas. The visitor car Parking requirement is 1 space per 10 beds (for students and/or visitors). |
Purpose Built Student Accommodation (Use Class C2): Area 1: 1 space per 10 bedrooms. Area 2: 1 space per 7.5 bedrooms. Area 3: 1 space per 5 bedrooms (lower provision will be appropriate in campus situations) |
C2 PBSA is differentiated. Notes that it is based on discussions with Planning/Highways |
|
Newcastle 2015 Parking Standards |
Swansea(March2012)(referencedinthe2017 HMO andPBSA SPD) |
Plymouth (May 2013) (Maximum standard) |
Derby City (2013) |
|
Limited or no car parking provision is generally acceptable in PBSA |
1 space/25 beds for servicing, wardens and drop off areas (zone 1) 1 space/25 beds for servicing, wardens and drop off areas + 1 space/10 beds for students and visitors (zones 2-6) |
1 space/2 occupiers |
1 space/ 4 bed spaces (at least 1 space per 15 bed spaces or less should be for ambulance or mini-bus parking and indicated as parking for disabled people) |
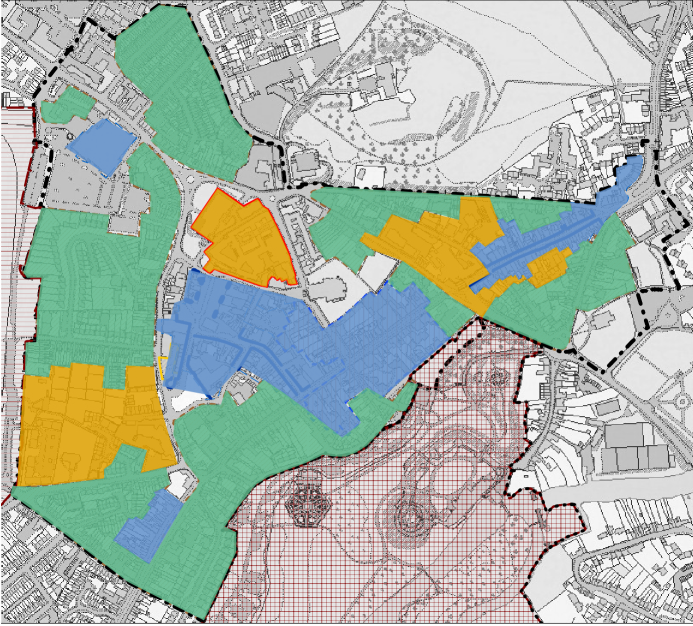
Appendix 3
Royal Leamington Spa
 Zone1
Zone1
Town centres, including area of search for major retail in Leamington
No area of impact or concentration constraints
 Zone2a
Non residential area of town centres
AOI: 1bed = 1m Concentration: No other PBSA in AOI
 Zone2b
Residential areas of town centres
AOI: 1bed = 1m Concentration: kitchen/ dwelling 25%
Zone 3
Thoroughfares outside of town centre
AOI: 1bed = 2m Concentration: kitchen/ dwelling 10%
Warwick
 Zone1
Zone1
Town centres
Zone 2a
No residential
 Zone2b
Residential areas
Kenilworth

 Zone 1
Town centres
Warwick District Council
RiversideHouseMilvertonHill
Royal LeamingtonSpa
CV325HZ