Local Plan Main Modifications 2017
Appendix A

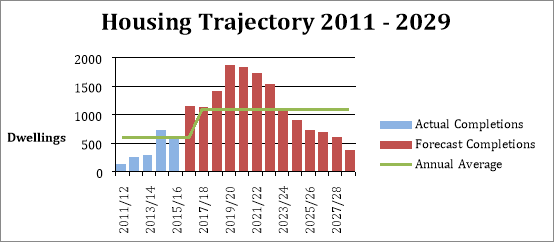
Summary of actual and forecast completions from all sources:
|
|
Completions 2011-2016 (Net) |
b) Commitments @ April 2016 (Net) |
b) Commitments - Care Homes @ April 2016 (Net) |
b) Commitments - Student Halls @ April 2016 (Net) |
c) Small Urban SHLAA Sites (Less 10% - rounded) |
d) Windfall Allowance |
e) Canalside & Employment Regen Areas |
f) Allocated Brownfield Sites |
g) Allocated Greenfield Sites |
h) Villages |
i) New Sites Jan 2016 |
j) Commitments Apr May 16 |
Total |
Cumulative Total |
|
Total (net) |
2051 |
6584 |
198 |
151 |
266 |
1010 |
200 |
930 |
1430 |
890 |
3204 |
225 |
17139 |
|
|
Year |
||||||||||||||
|
11/12 |
144 |
0 |
0 |
0 |
0 |
0 |
0 |
0 |
0 |
0 |
0 |
0 |
144 |
144 |
|
12/13 |
262 |
0 |
0 |
0 |
0 |
0 |
0 |
0 |
0 |
0 |
0 |
0 |
262 |
406 |
|
13/14 |
294 |
0 |
0 |
0 |
0 |
0 |
0 |
0 |
0 |
0 |
0 |
0 |
294 |
700 |
|
14/15 |
732 |
0 |
0 |
0 |
0 |
0 |
0 |
0 |
0 |
0 |
0 |
0 |
732 |
1432 |
|
15/16 |
619 |
0 |
0 |
0 |
0 |
0 |
0 |
0 |
0 |
0 |
0 |
0 |
619 |
2051 |
|
16/17 |
0 |
1040 |
117 |
2 |
0 |
0 |
0 |
0 |
0 |
0 |
0 |
0 |
1159 |
3210 |
|
17/18 |
0 |
954 |
49 |
109 |
0 |
0 |
0 |
20 |
0 |
0 |
0 |
0 |
1132 |
4342 |
|
18/19 |
0 |
1019 |
0 |
37 |
41 |
0 |
0 |
45 |
20 |
88 |
75 |
100 |
1425 |
5767 |
|
19/20 |
0 |
840 |
32 |
0 |
66 |
101 |
5 |
65 |
200 |
229 |
260 |
75 |
1873 |
7639 |
|
20/21 |
0 |
676 |
0 |
0 |
88 |
101 |
0 |
90 |
245 |
226 |
369 |
50 |
1845 |
9484 |
|
21/22 |
0 |
590 |
0 |
0 |
0 |
101 |
15 |
115 |
295 |
186 |
430 |
0 |
1732 |
11216 |
|
22/23 |
0 |
558 |
0 |
0 |
0 |
101 |
15 |
70 |
270 |
131 |
400 |
0 |
1545 |
12761 |
|
23/24 |
0 |
407 |
0 |
0 |
0 |
101 |
10 |
95 |
140 |
30 |
305 |
0 |
1088 |
13849 |
|
24/25 |
0 |
257 |
0 |
0 |
0 |
101 |
20 |
125 |
100 |
0 |
305 |
0 |
908 |
14757 |
|
25/26 |
0 |
100 |
0 |
0 |
5 |
101 |
35 |
130 |
60 |
0 |
305 |
0 |
736 |
15493 |
|
26/27 |
0 |
100 |
0 |
0 |
26 |
101 |
55 |
80 |
50 |
0 |
295 |
0 |
707 |
16200 |
|
27/28 |
0 |
100 |
0 |
0 |
27 |
101 |
40 |
70 |
50 |
0 |
230 |
0 |
618 |
16818 |
|
28/29 |
0 |
0 |
0 |
0 |
14 |
101 |
5 |
25 |
0 |
0 |
230 |
0 |
375 |
17193 |
|
|
||||||||||||||
|
Total (gross) |
2051 |
6641 |
198 |
148 |
266 |
1010 |
200 |
930 |
1430 |
890 |
3204 |
225 |
17193 |
|